The BEH group uses a series of epidemiological studies and health surveys to study neighborhood effects on health. We have also developed a rich GIS archive of geospatial data describing built and social environment conditions in NYC and across the U.S. Several of the data sets are highlighted below.
- Neighborhood Walkability: Based on urban planning and design literatures we have created a series of measures of walkability for the entire city and for every Census tracts in the U.S. from 1990 to 2020 [1, 2, 3].
- 1990-2022 NETS data: Thirty years of Dunn & Bradstreet business listing data which can be used to describe retail food environments [4], commercial physical activity venues and a multitude of other commercial spaces.
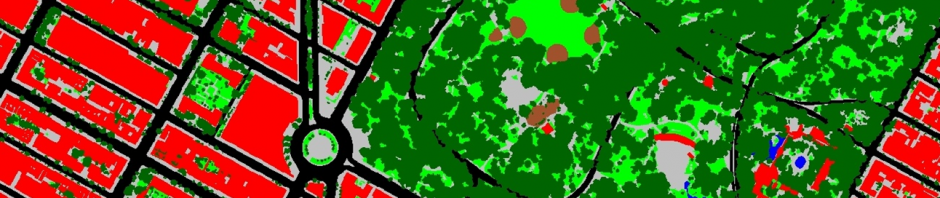
- 2010 Land Cover: Using 2010 LiDAR data we created a high-resolution data set describing land cover in NYC, accurate to 6 inches. These data provide highly detailed measures of the urban forest canopy and green space.
- Safety: We have point level data on car versus pedestrian and car verses cyclist accidents and homicide data from the NYC Police Department [5].
- Park Area and Quality: We have combined data from the NYC Department of Parks & Recreation, Park Inspection Program with park boundary data to measure access to parks and playgrounds, the cleanliness of parks and quality of the playground facilities [6].
- Socioeconomic and Racial/Ethnic Composition: We use the 2000 Census and ongoing American Community Survey data to measure socio-demographic characteristics of neighborhoods. We have used simple measures, such as percent poverty and median household income, and multidimensional measures like the Neighborhood Deprivation Index [7]. We have also developed measures that show the extent to which a neighborhood is an immigrant enclave [8].

