
We collaborated with the New York City Department of Health and Mental Hygiene to conduct spatial analyses of GPS and accelerometer based measures of physical activity collected as part of the Department’s Physical Activity and Transport (PAT) Study. Week long GPS monitoring and accelerometer data were collected from ~670 volunteers from across New York City. We used the GPS data to develop more specific measures of the neighborhood space that residents actually use and tested whether neighborhood characteristics are associated with physical activity. Our paper on using GPS data to study neighborhood walkability is here and the DOHMH Epi Data Brief for this project is here. We have also studied how urban canyons and tree cover interfere with GPS signals and cause measurement error defining study participant’s mobility patterns.
It is typical for neighborhood health studies to define study subject’s residential neighborhood as a 1 Km radius circle around the home (1 Km radial buffer) or the space accessible within 1 Km distance from the home in all directions along the street network (1 Km street network buffer). We used the GPS data to test how well these neighborhood definitions align with the extent of neighborhood space actually accessed by the study subjects.
The figure below shows GPS data collected from within 1 Km of a home (1 Km radial buffer), with each day worth of GPS colored coded and the 1 Km street network buffer shown in blue.
Figure 1. Example of GPS readings with the residential neighborhood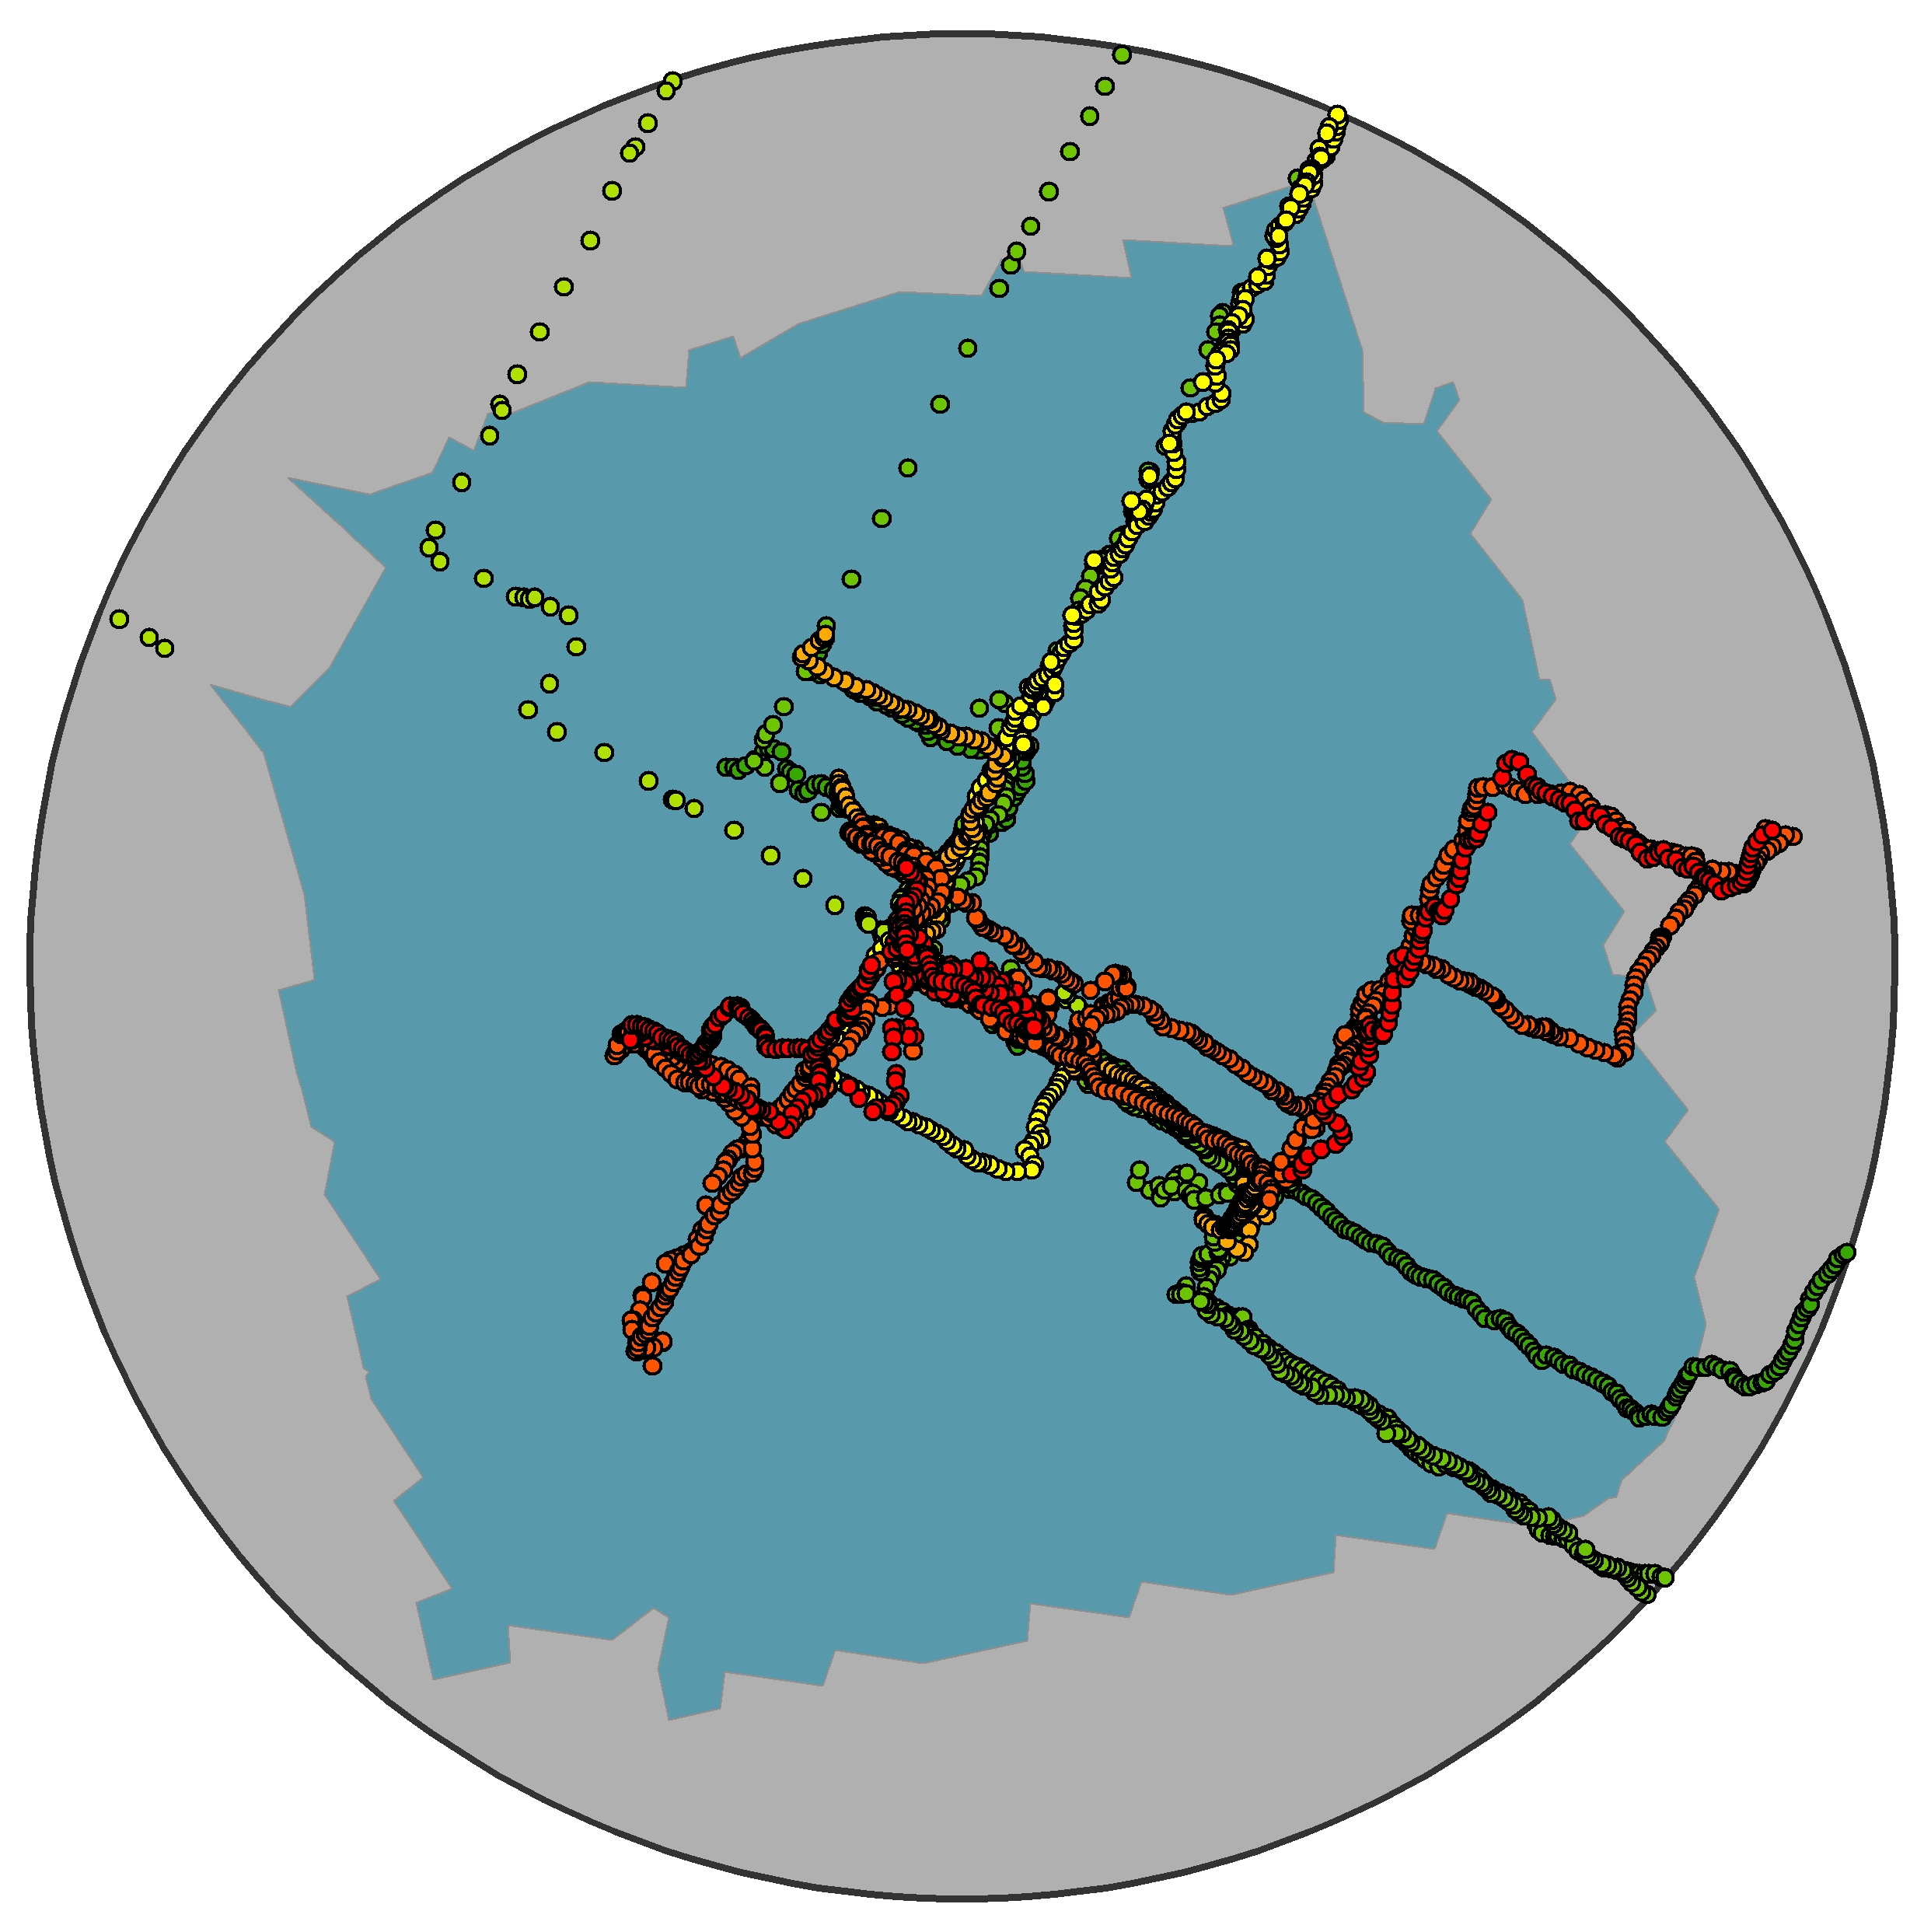 We used GIS tools to define the minimal polygon that contains the GPS points falling within the 1 Km radial buffer (blue area in Figure 1) and compared the neighborhood areas that fall within this polygon to the areas with 1 Km of the home that do not fall within the polygon. We found that on average residents of New York City utilize significantly less neighborhood space than would be assumed using a 1 Km radial buffer to define a neighborhood. The GPS data showed that residents preferentially use areas of their neighborhood that are more walkable. We also found that intersection density is one of the key predictors of how much area within a neighborhood is used by its residents.


Pingback: DOHMH releases Data Brief on Neighborhood Walkability and Physical Activity | Built Environmental and Health Research Group