Falls are the leading cause of injuries and functional decline among persons aged 65 years and older and falls increase the risk of subsequent institutionalization. We estimate that in 2023 there were ~170,000 Emergency Medical Services (EMS) responses to pedestrian falls on streets and sidewalks in the U.S. Of these, 43,046 (26%) EMS responses were for patients age 50-64 and 70,148 (42%) were for patients age 65 or older. We have previously shown that, while injuries from motor vehicles are more likely to be severe than those from pedestrian falls, because the number of falls is so much larger, among older adults the population burden of severe injuries is 4 fold higher for pedestrian falls compared to pedestrian injuries from motor vehicles.
The negative impact of falls on the function and health of older adults, and the particular threat to healthy aging while living independently in their community, is well established. There is a robust body of research on causes and prevention of falls occurring indoors, but causes of falls occurring outdoors are woefully understudied. Unlike indoor falls, which are influenced by an individual’s risk factors and health status, outdoor falls are often associated with health-promoting activities (e.g. walking), and are in particular influenced by environmental factors and physical aspects of the environment. Classical falls prevention doctrine has focused on person-level factors and omits the environment beyond the individual’s home. For example, fall prevention guidelines from the American Geriatric Society, British Geriatric Society and American Association of Orthopaedic Surgeons reported on the person-level and in-home environment risk factors for falls but did not examine environmental hazards outdoors.
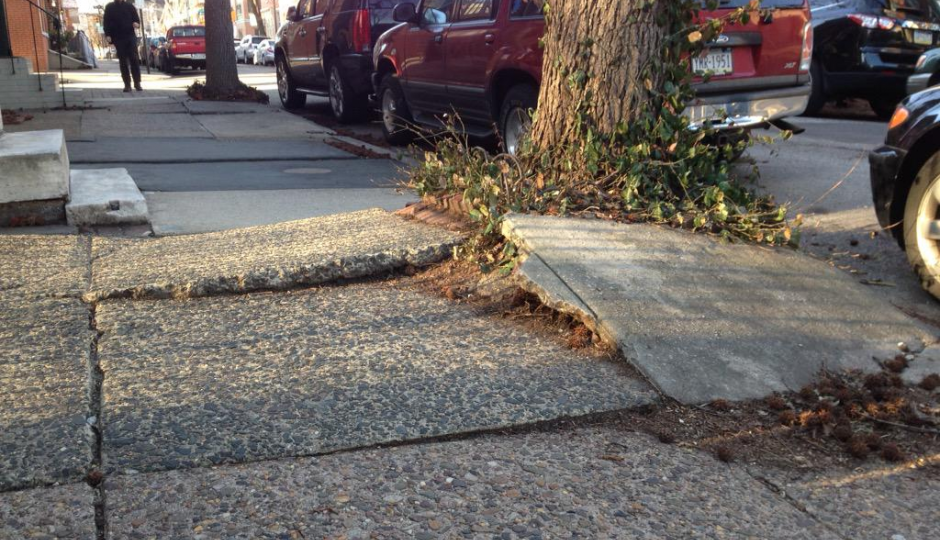
Creating urban environments that support the health and engagement of older persons is becoming increasingly important as populations age. Multiple characteristics can contribute to making a pedestrian environment “age-friendly” including walkable design, ambient temperature, lighting, signage, appropriate street crossing design or crossing speeds, and provision of seating. But pedestrian safety is also critical and requires proper maintenance of sidewalks. Designing an age-friendly street environment is therefore not a straightforward task and involves many trade-offs. For example, street trees create welcoming and shadier environments that encourage people to leave their homes and be physically active. The shade they provide also reduces ambient temperatures on streets, which improves thermal comfort for pedestrians and prevents heat related deterioration of sidewalks, curbs and roads. Our recent work suggests that during warmer months higher tree canopy cover is strongly protective against falls. However, the roots of poorly chosen, inappropriately placed, or poorly maintained trees can disrupt pavements, and fallen leaves or branches can create trip hazards that increase the risk of falls. An appropriate policy response is further complicated by the disjointed responsibility for road and sidewalk maintenance – cities, counties and states maintain roads while property owners are responsible for sidewalk maintenance. The burden of injurious falls among older pedestrians suggests that new approaches are required that span all aspects of age-friendly design. It is likely that, rather than relying on individual property owners, more centralized mechanisms for sidewalk maintenance are required.
Our estimates are based on the National Highway Traffic Safety Administration’s (NHTSA) 2023 National Emergency Medical Services Information System (NEMSIS) which is a national effort, covering all 50 states, to collect, store, and share standardized EMS data. In 2023 NEMSIS included data on over 54 million EMS activations. We have previously developed a method to identify in NEMSIS, EMS responses to pedestrians injured in falls or from motor vehicles.