
We entered a project into the Knight News Foundation Challenge: How can we harness data and information for the health of communities? Our proposal is to further develop our CANVAS: Street View project and make it available to researchers, agencies and community groups so they can easily use our system to run neighborhood data collection studies from anywhere in the world. You can see our project here. Please check it out and hit the “applause” button.
Our submission was motivated by a proposed research case-study to use CANVAS to identify characteristics of intersections that put pedestrians at risk of injury or death. Approximately 5,000 pedestrians in the US are killed by motor vehicles ever year and many fold more are injured.
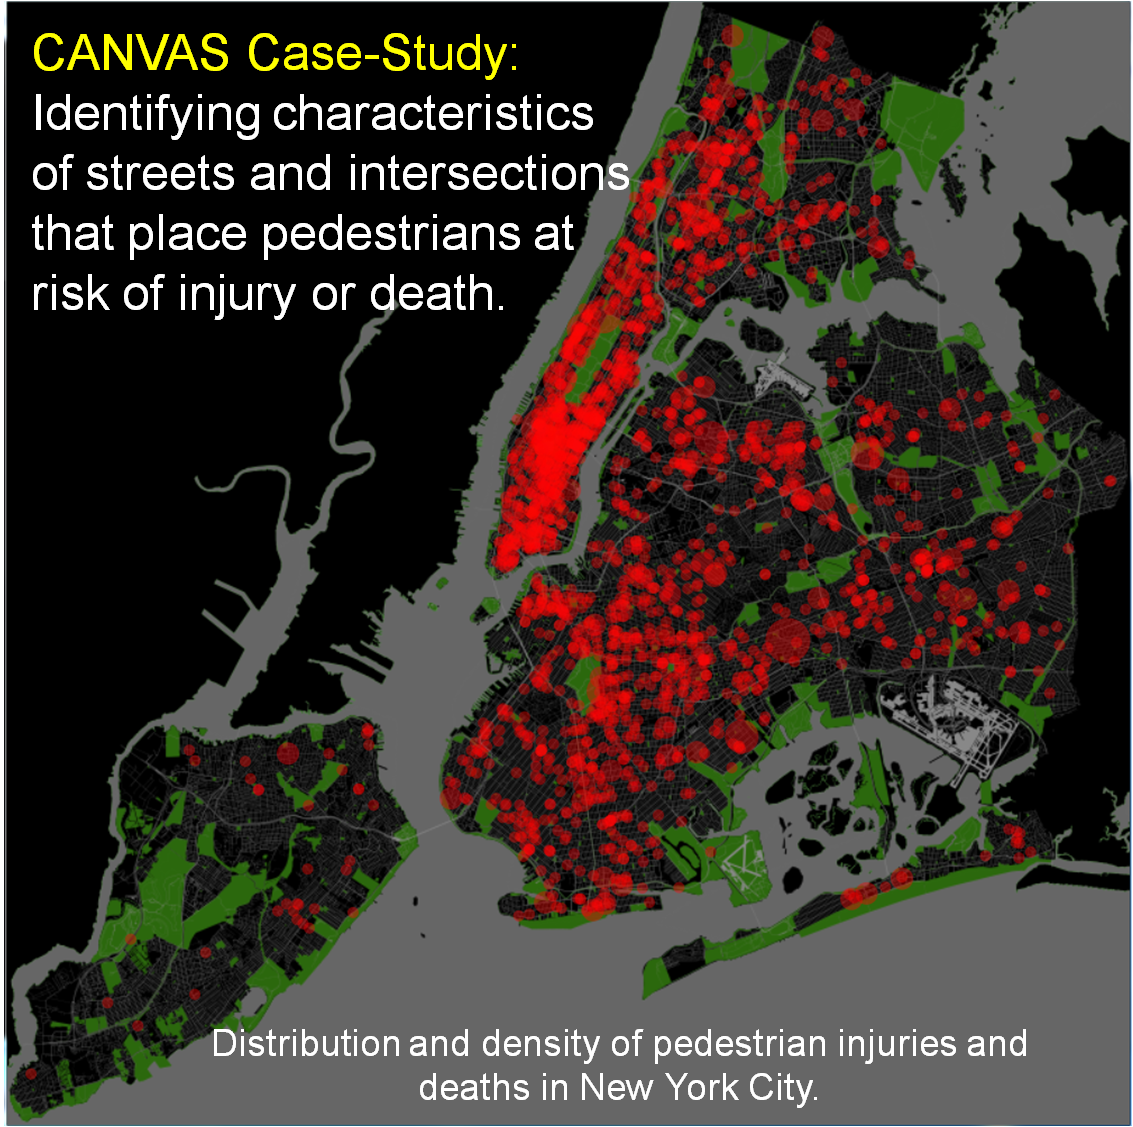
The CANVAS web application uses Google Street View imagery to gather neighborhood data. In this case-study we illustrate the assessment of intersection design at pedestrian injury hotspots in NYC.
Research to identify modifiable characteristics of intersections (e.g. sight lines, crosswalks, curb extensions, traffic signals, lane width, etc.) that place pedestrians at risk is constrained by the need to send audit teams to deadly ‘case’ intersections and at safe ‘control’ intersections to collect data on intersection conditions. Publicly available, national databases of pedestrian injury/fatality locations can be fed into CANVAS allowing researchers to select high-risk and low-risk intersections and remotely visualize the intersections via Street View.
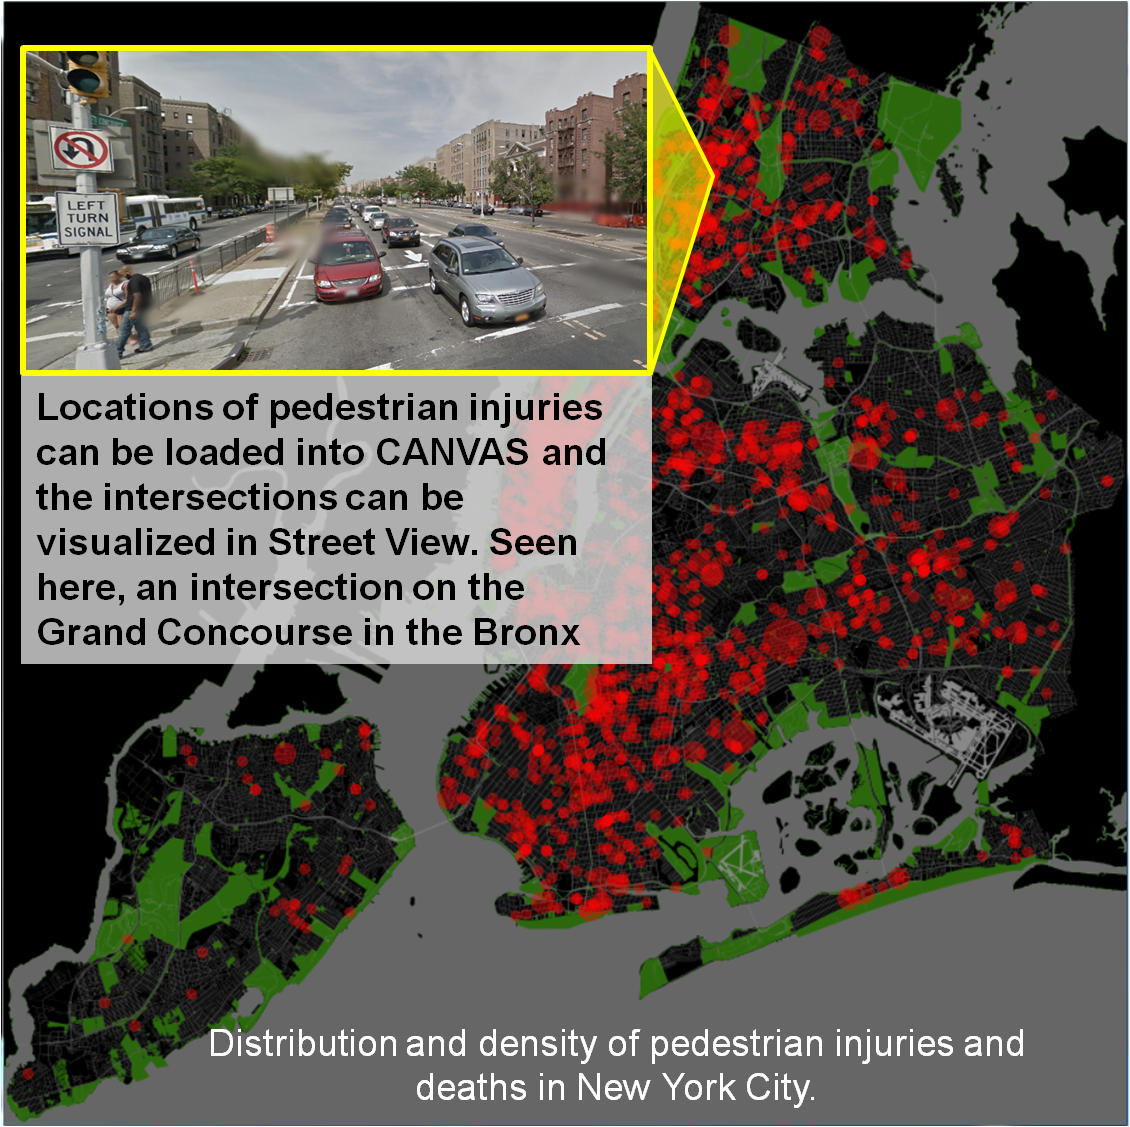
Data on the locations of pedestrian injuries & deaths can be loaded into CANVAS and the intersections can be systematically viewed in Street View.
Virtual walk-throughs of the intersections can be conducted to systematically collect observational data on street, sidewalk and intersection conditions that may place pedestrians at risk.
Virtual walk-throughs of intersections within CANVAS can be used to systematically collect observational data on street and intersection design and safety features.
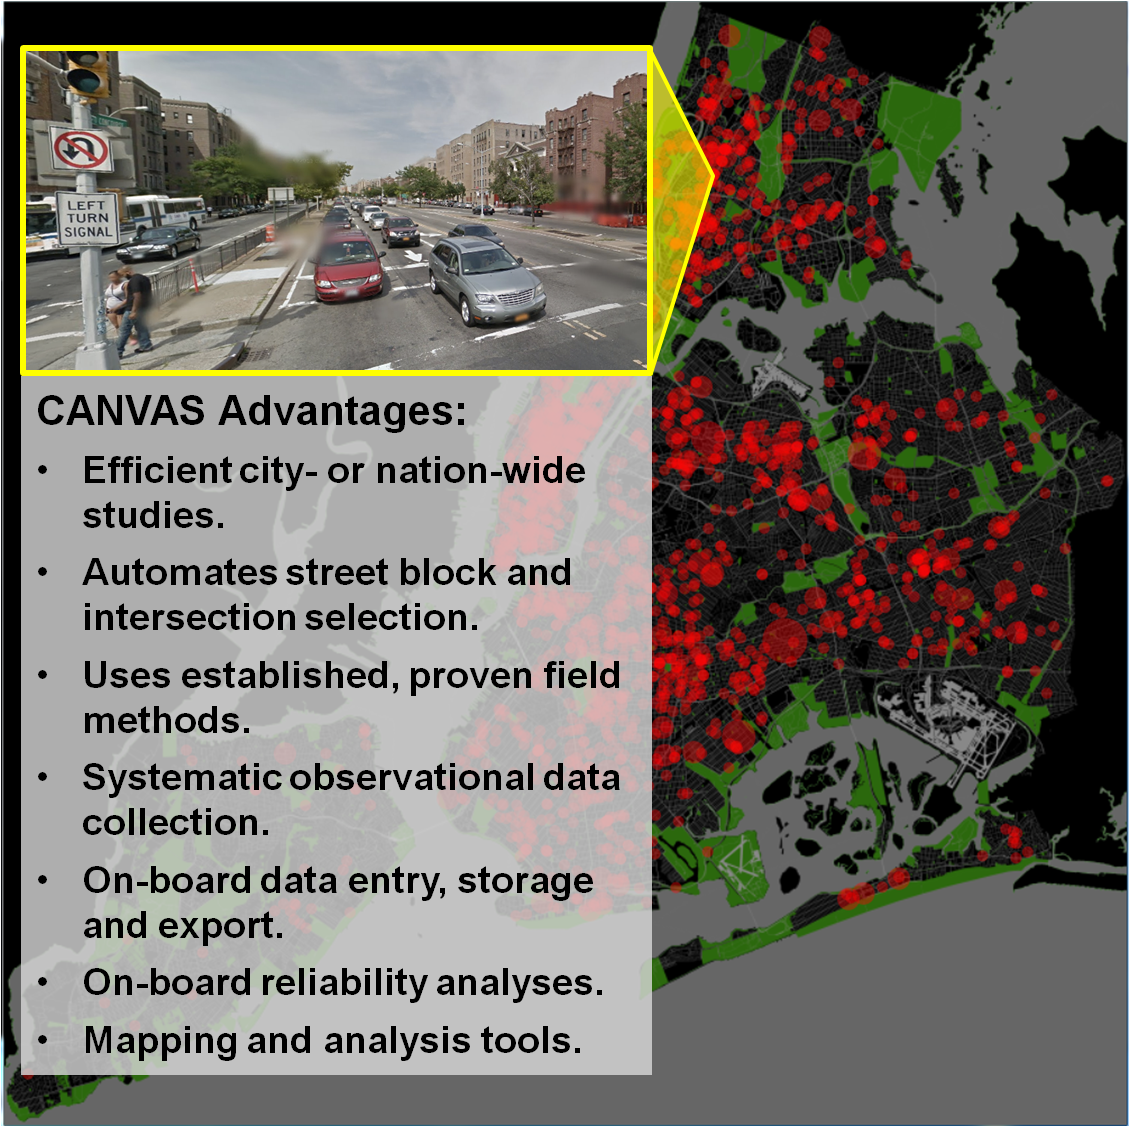
CANVAS can thus automate many of the steps in pedestrian injury research and can allow for affordable, national scale, representative studies with a high degree of efficiency.
CANVAS is a low cost, efficient tool for researchers, agencies and community groups who want to collect data on neighborhood conditions relevant to health.

