

Viewing 125th Street
We recently published three papers describing our use of Google Street View to conduct ‘virtual-audits’ to collect observational data on neighborhood characteristic and conditions.
A long established approach to collecting data on neighborhood conditions is to send trained observers to neighborhoods to collect data using standardized audit tools – an approach known as Systematic Social Observation and also Neighborhood Auditing. Essentially observers go to specified blocks in a neighborhood and complete checklists noting the presence or absence of neighborhood amenities or disamenities. However, this approach is time consuming – in our studies about 75% of researcher’s time is spent traveling to and from the observation sites – which limits the number of blocks that can be observed and the size and number of neighborhoods that can be included in a study. As an alternative we have developed a system known as CANVAS (Computer Assisted Neighborhood Visual Assessment System) that uses Google Street View and a series of customized add-on tools to allow researchers to conduct neighborhood audits from their desk-tops.
A recent publication in Health and Place describes the design, development and capabilities of CANVAS. CANVAS includes three interfaces: The Study Deployment Interface; The Auditor Interface; and The Analytics Interface. The Study Deployment Interface allows researchers to designate the street locations to be audited, designate the audit items for which data will be collected, and assign street segments to auditors. The Auditor Interface provides access to Google Street View, a data entry screen and tools to help the auditor collect data. Lastly, The Analytics Interface provides data collection reports to the study manager in real time, including data on: each auditor’s progress through the assigned street segments, inter-rater kappa (κ) statistics, and the minimum, maximum, and mean rating times for each module in the study. The paper also reports on the collection of data on 187 neighborhood characteristics related to walkability and physical disorder for a national sample of 150 street segments in the United States.
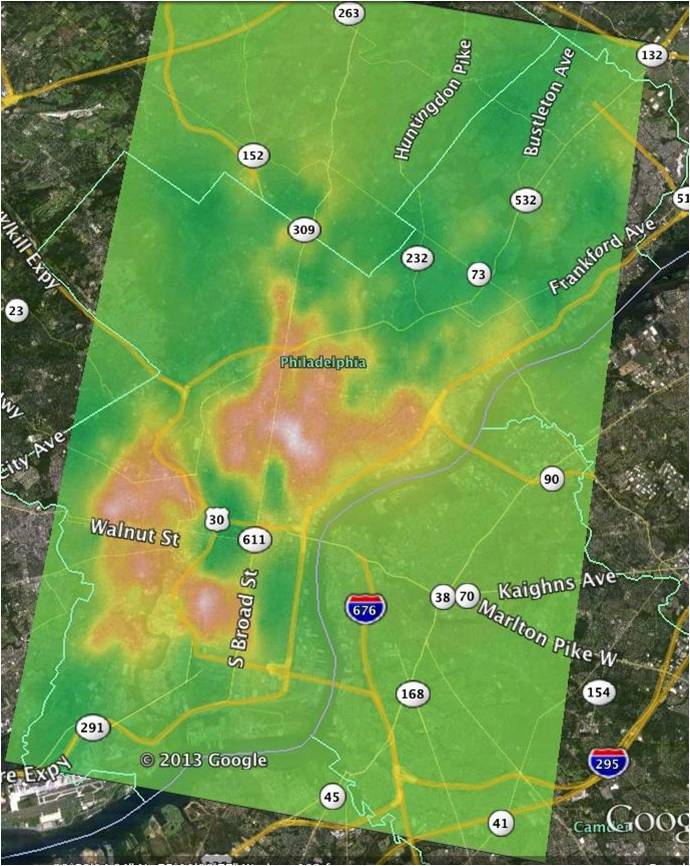
Physical Disorder across Philadelphia
A second paper published in the American Journal of Epidemiology describes the ecometric properties of a neighborhood physical disorder measure that we deployed in San Jose, California; Detroit, Michigan; New York, New York; and Philadelphia, Pennsylvania. The physical disorder measure was developed from nine previously validated indicator measures of physical disorder (e.g., litter, graffiti, and abandoned buildings). Using CANVAS these nine items were measured on a total of 1,826 block faces sampled from these four cities. A two-parameter item response theory model was then used with these data to estimate latent levels of disorder on each block face in each city and then kriging based interpolation methods were used to estimate physical disorder levels for every point in each city.
The third paper was published in the Journal of Maps and provides a hi-resolution map of neighborhood physical disorder in New York City. The map was developed from data on the nine physical disorder indicators measured on 532 blocks systematically sampled in New York City. As described in the American Journal of Epidemiology paper, these nine items were used to estimate latent levels of disorder on each block and then spatial interpolation methods were used to estimate physical disorder throughout the City. The map condenses a complex estimation process into an interpretable visualization of the spatial distribution of physical disorder in New York City.


Pingback: Cómo los coches de Google han cambiado nuestra forma de entender las ciudades | FIRS