
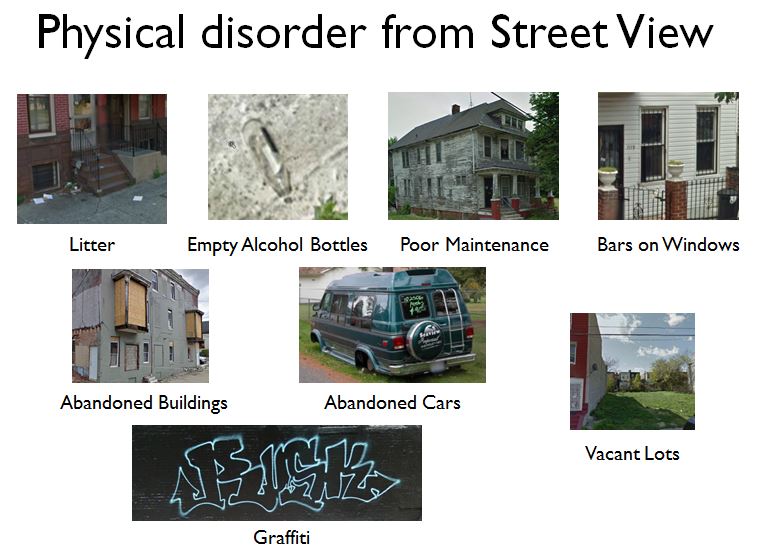
Elements that are incorporated into the overall Neighborhood Disorder Scale score.
Through the years, we have done a fair amount of work to collect and validate measures of neighborhood physical disorder – urban deterioration – using our CANVAS/Google Street View system. Neighborhood disorder is controversial construct and measure, not only because perceptions of what constitutes disorder can vary sharply between people – one person’s chaotic urban jungle is another person’s lively street scene – but also because the impacts of disorder – does disorder induce crime or is it just correlated with crime because the two share common causes such as neighborhood disadvantage? – are unclear.
One possible impact of disorder may be deterring physical activity, especially walking. In walk-along studies with older adults – wherein a researcher takes a walk with a study participant and asks about the neighborhood characteristics and how they affect the walker’s experience –many participants report that they don’t like or are threatened by indicators of disorder, such as graffiti, poor building maintenance, and similar signs of abandonment. But there has been relatively little rigorous longitudinal, population-based research on the extent to which disorder is a barrier to physical activity in practice. This is important, because if disorder is a major barrier to activity, then removing disorder, perhaps through aggressive blight removal and related clean-up programs, may have substantially positive implications for the health of aging populations trying to maintain active lifestyles.
We recently published a study using our disorder measure with data from the New York City Neighborhood and Mental Health in the Elderly Study (NYCNAMES-II), a three-wave cohort study of about 3,500 adults aged 65-75 at baseline, to see whether disorder seems to be impeding physical activity among older New York City residents. Too few study participants moved over the two years of follow-up for us to reliably assess the impact of moving from a neighborhood at one level of disorder to another, but we did find that, comparing across subjects, each standard deviation increase in neighborhood disorder (the difference between a neighborhood with no litter or graffiti to one where both were prevalent) was associated with an decrease in self-reported activity equivalent to about 6 min of walking per day. However, neighborhood physical disorder was not related to changes in physical activity over the two years of follow-up.
Ultimately, it seems that there is some meaningful association between living in a more disordered place and being less physically active, but that neighborhood disorder was not a major cause of decline in physical activity among these older adults. We hope to explore the relationship between disorder and physical activity more deeply in future research using datasets with longer follow-up and more dynamic neighborhood conditions.

