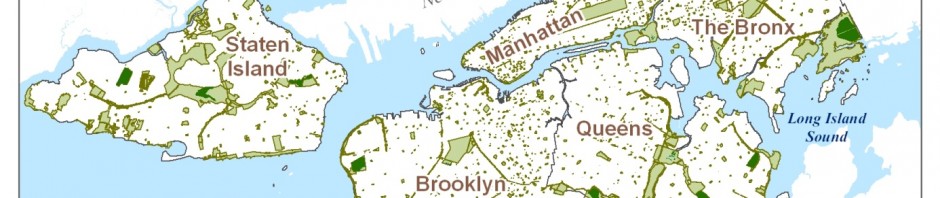
We have continued to work with Policymap.com‘s excellent data portal tool to map populations at risk of severe COVID-19. Our prior post is here. The map below shows Counties in purple with high numbers of adults 65 years or older and low availability of hospital beds. High numbers of adults 65 years or older was defined as more the U.S. median across counties (greater than 4,698 people) and low availability was defined as less than the median number of hospital beds (<49 beds). Population counts are from the Census Bureau for 2014-2018 and counts of hospital beds are from the Health Resources and Services Administration (HRSA) for 2016.

Counties in purple have large populations of older adults and low numbers of hospital beds.

