Beyond Your Waist and Lungs: BEH Investigates Pedestrian Injury Risk

While most of our work to date has been concerned with physical activity, obesity and asthma, the built environment can also shape injury risk.  Nearly 5,000 pedestrians in the U.S. are killed by motor vehicles ever year, and a small number of high-risk intersections account for a substantial proportion of vehicle-pedestrian collisions.  Modification of the road and pedestrian environment where collisions occur is an attractive potential intervention both to save lives and to promote pedestrian and cycling activity (active transport). Previous research on the relationship between  pedestrian environment characteristics and collision risk has uncovered counter-intuitive findings, including that crosswalks may pose an increase in risk to older pedestrians, but research on pedestrian injuries has been limited due, in part, to the high cost of visiting collision sites and comparison intersections to collect data on intersection characteristics.

We were recently awarded a pilot grant from the Center for Injury Epidemiology and Prevention at Columbia University Medical Center to investigate the relationship between pedestrian environment characteristics in New York City, as assessed using our CANVAS tool, and the risk of a pedestrian-motor vehicle collision serious enough to warrant a police report.  Using CANVAS, we expect to be able to collect data much more efficiently than in-person audits have been able to, unlocking a new data source to understand which intersection modifications can best reduce collisions between cars and people.

Canvas_concept_image_3

Posted in CANVAS, Safety, Street View | Leave a comment

Our Knight Foundation News Challenge project moves forward: so we made a video

Out of the 643 entries submitted to the Knight Foundation News Challenge, our project “Open CANVAS: A Web Application Harnessing Google Street View to Collect and Share Data on Neighborhoods” was one of the 40 projects selected as finalists.  Each team was asked to revise their projects for the next round of review and to make a 30 second video explaining the project.  Here is what we came up with…

A ‘making of the video’ blog post is here.

Posted in CANVAS, Street View | Leave a comment

Food Environment Impact: Fast Food vs. Bodegas

In urban areas such as New York City, many corner stores (“bodegas”) offer prepared or ready-to-eat food. In studies of the food environment, researchers usually consider bodegas as grocery stores, and compare them with large stores such as supermarkets. But many bodegas sell packaged ready-to-eat items or prepared food from deli counters, salad bars, or steam tables – in other words, they fill a similar niche in the food environment as fast food or take-out restaurants. What would happen, we wondered, if we compared the nutritional environment of bodegas to that of another outlet type well-known for offering inexpensive and convenient food – national chain fast food restaurants?

fast-foodWith support from an ARRA supplement to our grant from NIDDK, as well as from the ISERP summer intern program, we sent five student interns into the field to find out. We used the NEMS-R (Nutrition Environment Measurement Study for Restaurants) audit protocol for both fast-food restaurants and bodegas. A widely used tool for evaluating nutrition environments, the NEMS-R measures the availability of healthy food and beverages (e.g. fresh fruit, low-fat milk). It also looks for ways a food outlet might prompt or incentivize healthy or unhealthy eating, for instance by providing calorie counts or offering “all you can eat” specials. Along with Laszlo Lovasi and Karla Milinkovic, who managed the fieldwork, the students audited more than 200 bodegas and fast-food outlets in Manhattan, Brooklyn, and the Bronx. Continue reading

Posted in Food Environment | Leave a comment

Our Entry for the Knight News Challenge: How can we harness data and information for the health of communities?

We entered a project into the Knight News Foundation Challenge: How can we harness data and information for the health of communities?  Our proposal is to further develop our CANVAS: Street View project and make it available to researchers, agencies and community groups so they can easily use our system to run neighborhood data collection studies from anywhere in the world.  You can see our project here.  Please check it out and hit the “applause” button.

Our submission was motivated by a proposed research case-study to use CANVAS to identify characteristics of intersections that put pedestrians at risk of injury or death.  Approximately 5,000 pedestrians in the US are killed by motor vehicles ever year and many fold more are injured.

Canvas_concept_image_1

The CANVAS web application uses Google Street View imagery to gather neighborhood data. In this case-study we illustrate the assessment of intersection design at pedestrian injury hotspots in NYC.

Continue reading

Posted in CANVAS, Safety, Street View, Urban Design | Leave a comment

Food Environment and BMI in NYC

We have continued our work studying the food environment in NYC, developing measures that take a more ecosystem perspective on neighborhood food environments.  For each zip code, we measured the density of food outlets, the proportion of retail food outlets that were BMI-healthy (supermarkets, fruit and vegetable markets, natural food stores) or BMI-unhealthy (local and national fast food restaurants, pizza restaurants, convenience stores, bodegas, bakeries, candy and nut stores, meat markets) and the overall diversity of the food environment.

CHS_food_environment

Continue reading

Posted in Adults, Food Environment | Leave a comment

New Book on Urban Design

A new book by Reid Ewing and Otto Clemente, Measuring Urban Design: Metrics for Livable Places (Island Press, 2013) includes a chapter by BEH researchers.

The chapter, by Kathryn Neckerman, Marnie Purciel, James Quinn, and Andrew Rundle, reports on a study of urban design in New York City. Reid Ewing and colleagues developed an audit protocol for measuring urban design qualities. With funding from Robert Wood Johnson Foundation Active Living Research, we used this protocol to measure urban design in a sample of neighborhoods in New York City. During the summer of 2006, student interns at Columbia criss-crossed the city to characterize the streetscape on 588 block faces. 

Following Ewing’s protocol, we examined five urban design qualities. Imageable places have a memorable or distinctive quality; imageability is measured with indicators such as non-rectangular buildings, plazas, and historic buildings. Enclosure is the quality of a well-defined and room-like space; indicators of enclosure include a “street wall” in which buildings are lined up adjacent to the sidewalk rather than being deeply set back behind parking lots. Human-scale places have smaller-scale buildings and street furniture that suggest a streetscape designed for pedestrian use. In transparent places, human activity beyond the street wall is visible (as with ground-floor windows) or at least implied. Complexity refers to a density of visual detail, and is indicated by multiple buildings with a variety of colors as well as other visual stimuli such as public art, pedestrians, and outdoor dining.

Urban_design_measures

Estimates of the urban design qualities of Imageability, Enclosure, Human Scale, Transparency and Complexity across NYC estimated from data from 588 block faces.

Continue reading

Posted in Active Transport, Aesthetics, Urban Design | Leave a comment

Neighborhood Fast Food Restaurants, Economic Investment and Adolescent Obesity

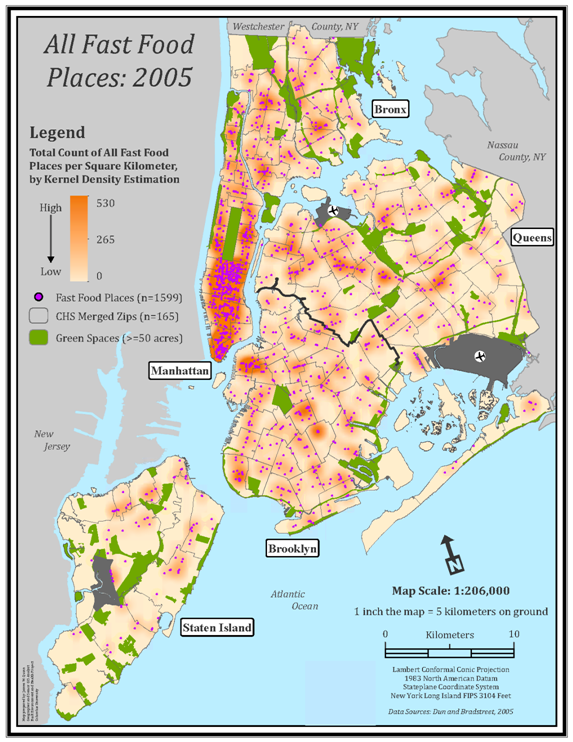
Many researchers, public health officials and policy makers suggest that neighborhood characteristics may influence dietary and physical activity patterns and thus influence obesity risk.  Because of the evidence that fast food consumption is linked to obesity, researchers interested in neighborhood effects on health have often focused on fast food outlet availability, but have assessed fast food availability as an isolated component of the overall food and retail environment.  When we analyzed links between adolescent obesity in New York City and the density of fast food outlets in neighborhoods as a single measure of neighborhood food availability, we found that a higher density of fast food restaurants was associated with lower adolescent obesity.  But when interpreting this finding, one needs to understand that fast food restaurants don’t exist in a vacuum, they are part of a larger ecosystem of neighborhood businesses and are embedded within larger trends of neighborhood economic development and investment.

There are a number of reasons to suspect that overall economic development in a neighborhood might matter for resident’s health.  A larger retail presence might provide what Jane Jacobs termed “eyes on the street” to prevent crime, a political lobby to support neighborhood services, and, of course, employment for local residents.  We used the number of banks within the neighborhood as a measure of local economic development, a neighborhood resource not expected to directly influence adolescent’s physical activity or dietary patterns.

We found that the density of banks correlates with the density of fast food outlets in a neighborhood and that the density of banks within a neighborhood was also associated with lower adolescent obesity.  Since banks could not reasonably be assumed to directly affect adolescent health on their own, we interpret this finding to suggest that investment patterns might relate to adolescent obesity.  These analyses adjusted for measures of the family’s income and for neighborhood poverty rates, so these findings are not simply a function of childhood poverty.  These findings, we think, show the complexity of studying the effects of neighborhood food environments and overall development patterns on health. It also highlights the importance of studying the health effects that result from the complex ecosystem of economic and residential investment.

A paper describing this research will be published soon in Health and Place and is available online here.  For these analyses we used data from the 2007-2008 NYC FITNESSGRAM program linked to the Census tract of residence.  This is the first in a series of papers we are publishing investigating the complexity of the urban economic ecosystem, including investigating how the density and diversity of food options in neighborhoods might influence obesity outcomes. We think that this paper provides a preliminary finding that we hope will encourage more research that investigates how economic development might influence health outcomes.

Posted in Childhood, Economic Development, FITNESSGRAM, Food Environment | Leave a comment

Steve Mooney receives Award at Society for Epidemiologic Research Annual Meeting

Steve Mooney, a doctoral student with the BEH group, won a best poster presentation award at the Society for Epidemiologic Research annual conference for his work on the effects on causal inference of error in measuring contextual variables.

Proportion of residents living in poverty, median household income and per capita income data from the Census are commonly used neighborhood-level contextual measures all of which are derived from personal income information provided to the Census bureau, information likely to be provided with some degree of error.  Steve shows that this error in individual’s reporting of income, even if random and non-differential, causes bias in effect estimates for analyses of associations between neighborhood-level socioeconomic data and individual’s health outcomes.  However, the direction of the bias depends on which of the neighborhood-level socioeconomic variables available from the Census the investigator chooses to use in the analyses. In the face of error in the underlying data collected by the Census, the use of neighborhood-level variables expressed as proportions (proportion living in poverty) results in bias away from the null.  While the use of neighborhood-level variables expressed as a continuum (median household income) can cause bias towards or away from the null.  The extent of bias in this later case is determined by the extent of measurement error, number of neighborhood units included in the study and the number of individuals per unit whose individual-level data were aggregated to create the neighborhood level variable.

Posted in Methods | Leave a comment

Obesity among Children from Low Income Families in NYC

Our recent paper in published in the journal Preventive Medicine looks at obesity among children in a means-tested preschool program in New York City.  Among the 11,562 children from low income families enrolled the program in 2004, 16% were overweight and 24% were obese.  Children living in zip codes with higher homicide rates were significantly more likely to be obese, while the density of street trees in the zip of residence was significantly inversely associated with the likelihood of the child being obese. Access to park space and neighborhood walkability in the zip code were not associated with obesity among these children.

This work was conducted in collaboration with the New York City Department of Health and Mental Hygiene and the Administration for Children’s Services.

Posted in Childhood, Safety | Leave a comment

Neighborhood Access to park space and BMI

Our recent article in the American Journal of Health Promotion explores the association between New York City resident’s body mass index (BMI) and their access to neighborhood parks, park quality, and park physical activity resources. Our analyses show that higher residential neighborhood access to large parks (>6 acres) is associated with lower BMI scores.

We measured neighborhood park access for ~13,000 residents of New York City whose height and weight had been measured and who had provided questionnaire data on their socio-demographic characteristics.  For each study subject we measured the amount of park space within a 1/2 mile of the home (see figure below), used NYC park inspection data to measure the cleanliness of the parks and measured the number of park based physical activity resources (e.g. ball fields, courts, trails) .  While the cleanliness of the parks and the availability of physical activity resources in the parks were not associated with BMI, higher access to parks was associated with lower BMI.

Measuring neighborhood park access

Measuring neighborhood park access (AJHP 2013, Vol 27(3), 262-9)

Posted in Adults, Parks | Leave a comment